
Anisole ¹H NMR Spectrum
Explore the HQSpectrum-simulated ¹H NMR spectrum of anisole at 80 MHz. Anisole is also known as methoxybenzene.
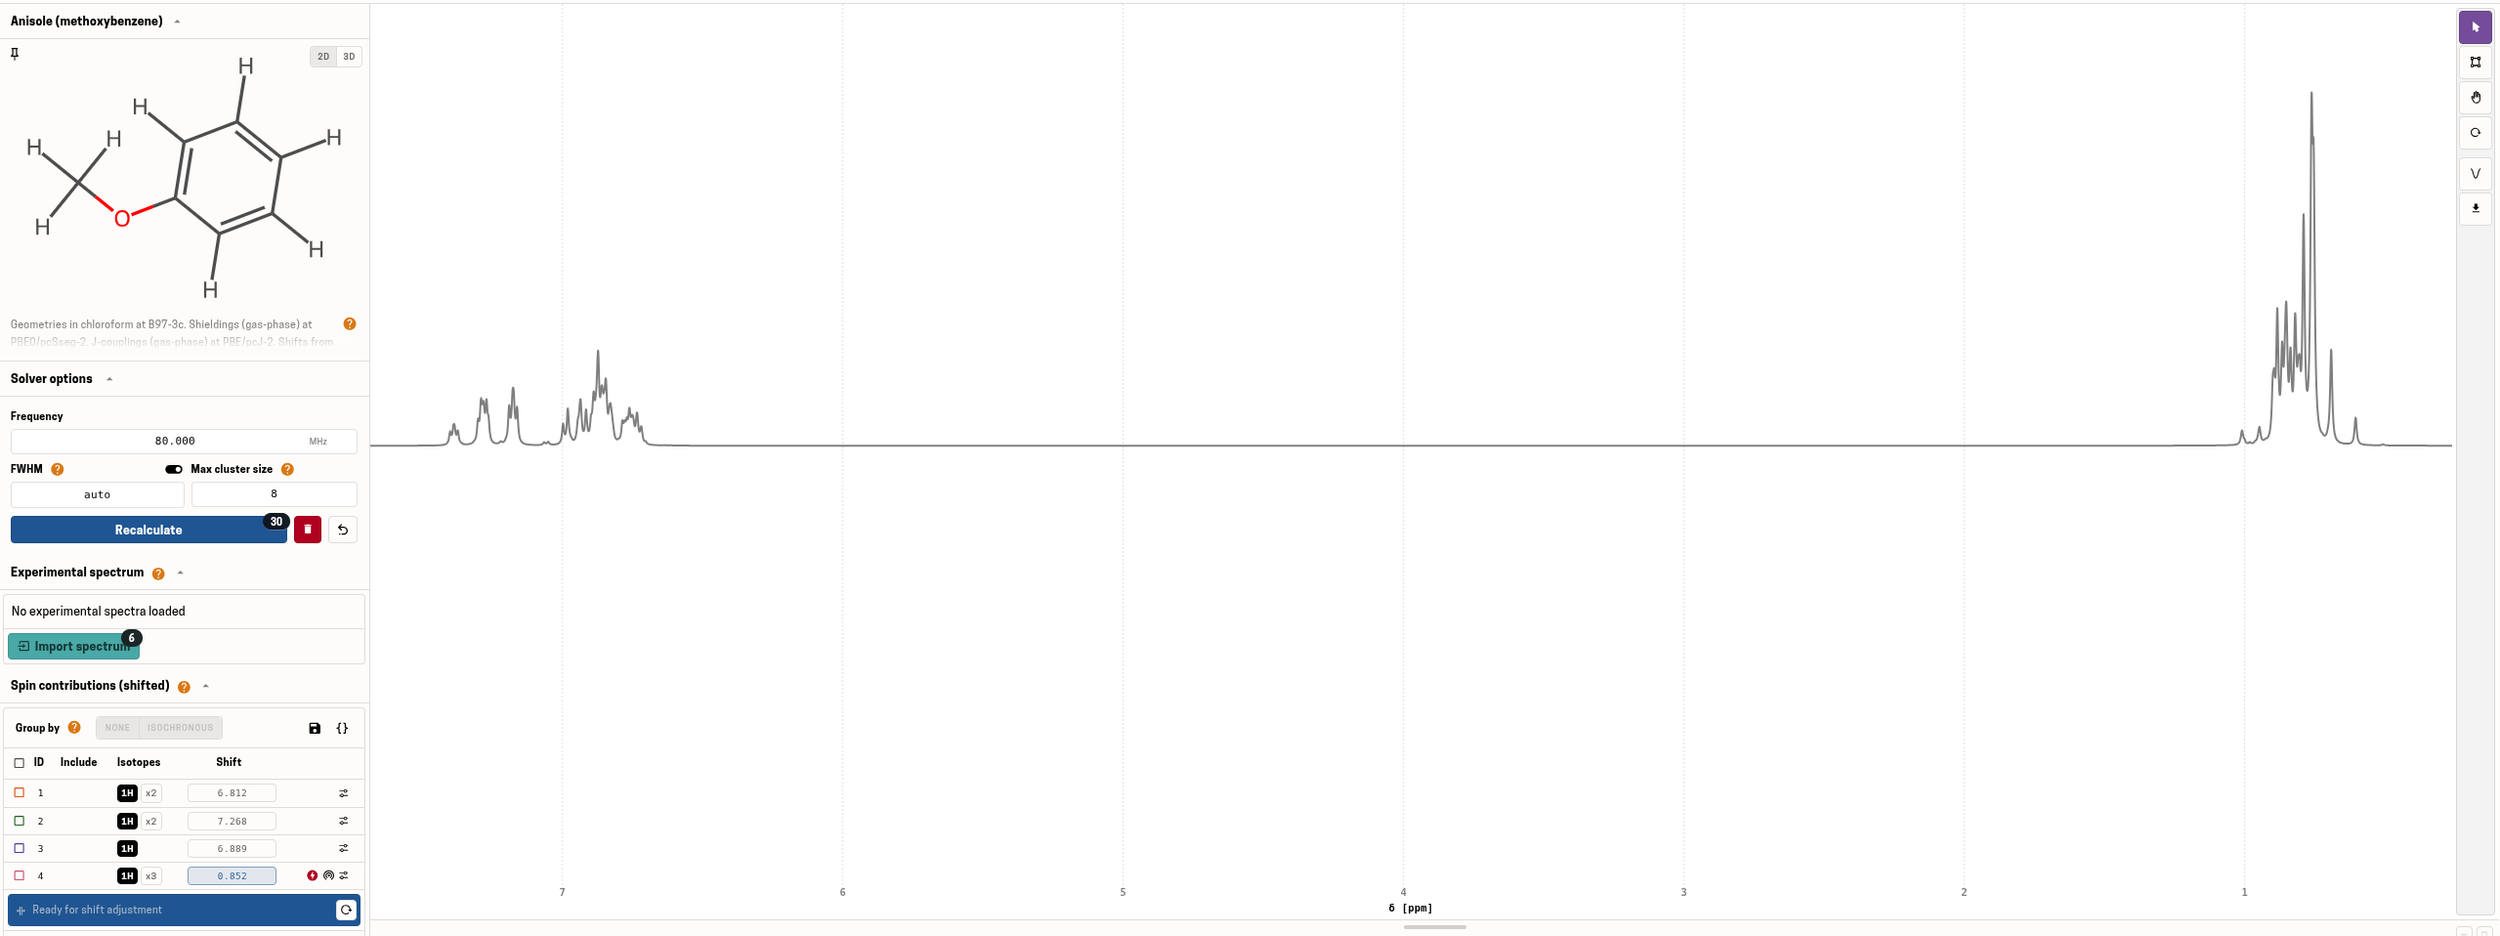
Which nuclei contribute to the spectrum?
HQSpectrum uses matching colors to connect selected nuclei in the molecule drawing to their simulated signals. The contribution view helps you see which nuclei contribute to a peak, including individual parts of peaks where signals overlap. It shows selected calculated contributions, not a complete atom-by-atom assignment.
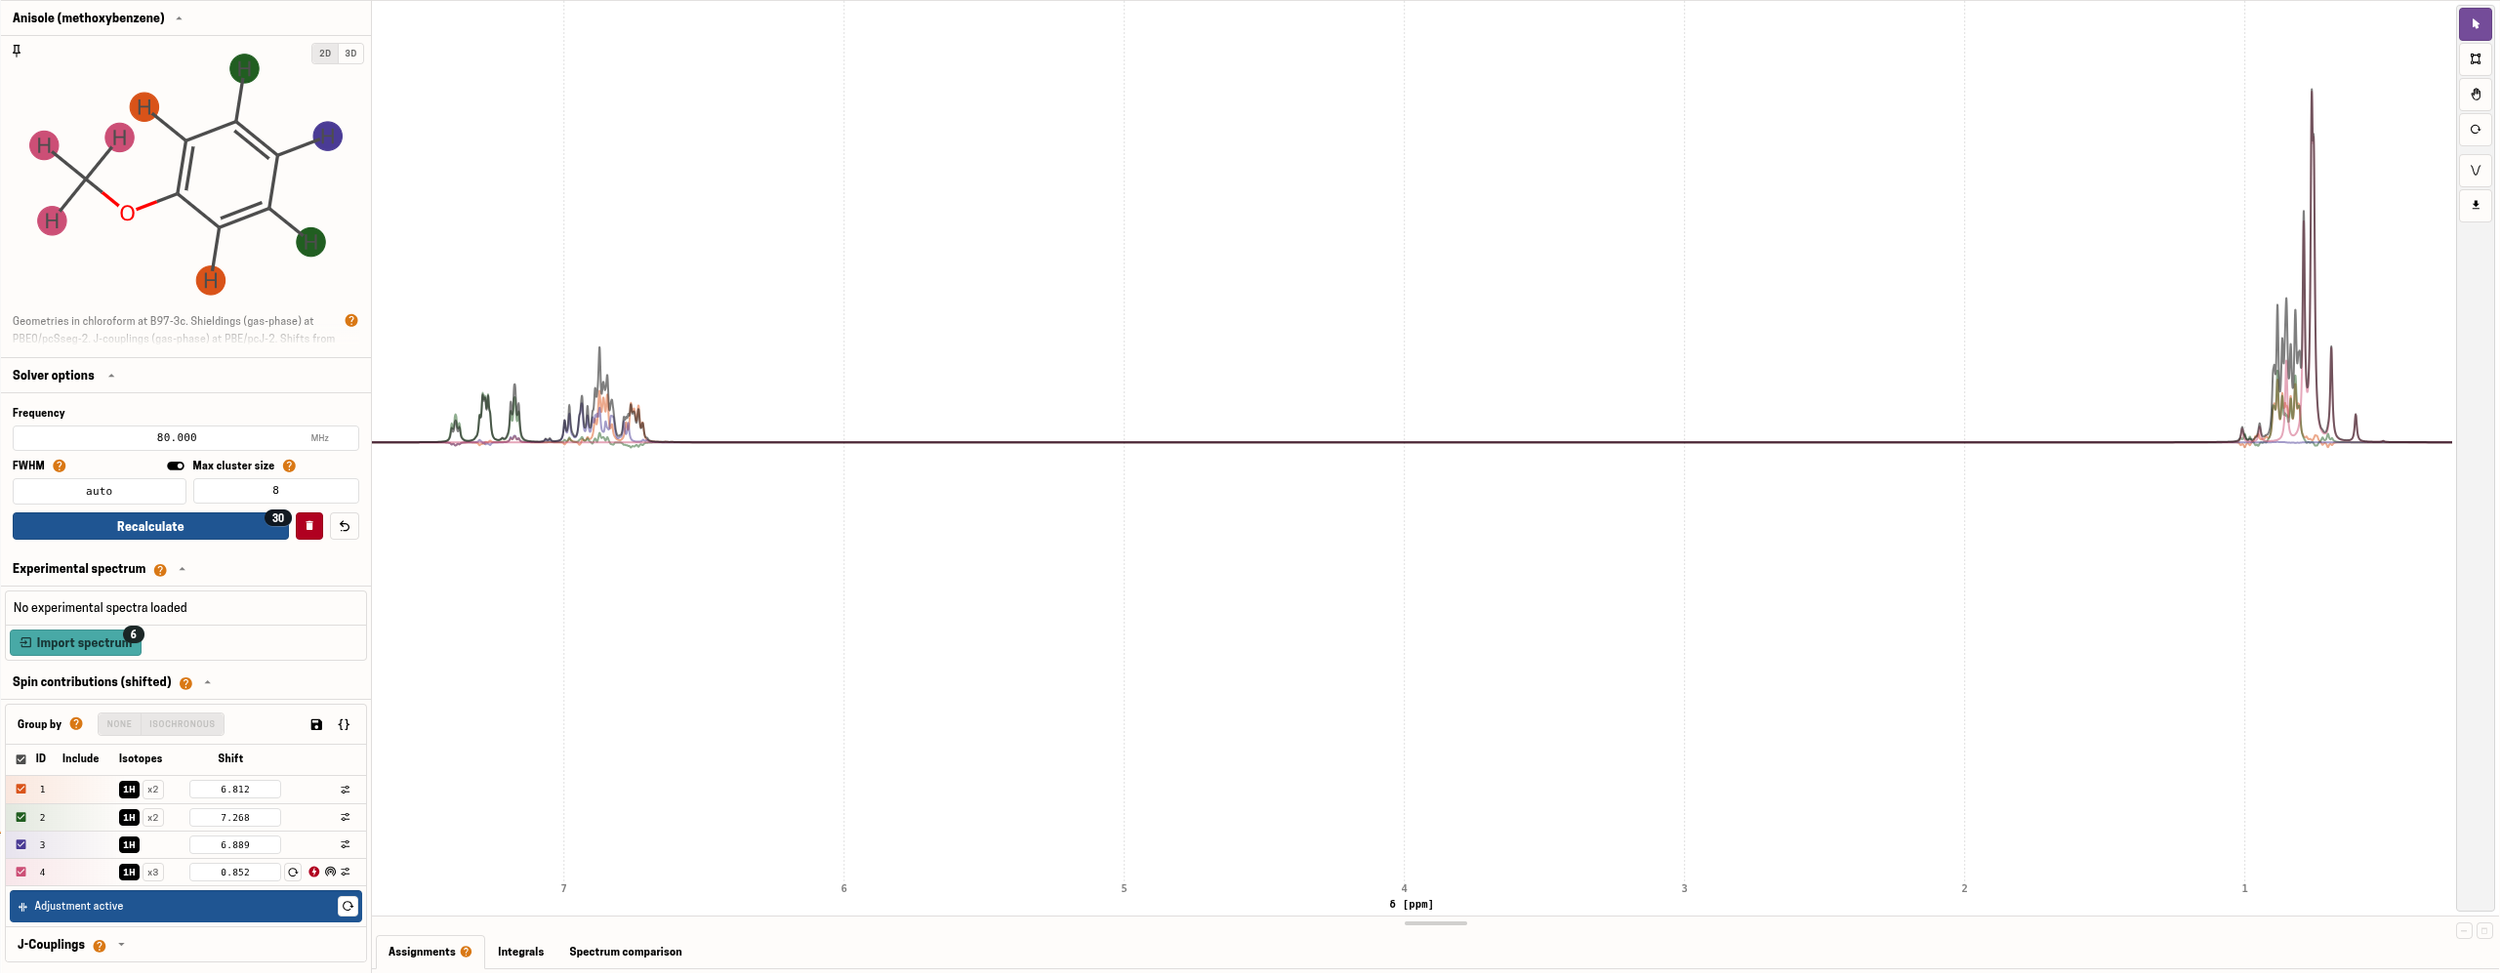
The 80 MHz simulation shows aromatic signals and a separate low-ppm group with fine structure.
Compare with your spectrum or explore another frequency
Both images show an 80 MHz simulation. Chemical shifts are expressed in ppm, while multiplet appearance can change with field strength, particularly at low field. Typical ¹H NMR frequencies include 60, 80, 300, 400 and 500 MHz.
In HQSpectrum, set a different spectrometer frequency to explore how the simulated pattern changes. You can also import your own experimental spectrum and compare it with a simulation. Calculated chemical shifts can differ from measured values, so HQSpectrum lets you examine the pattern and adjust the comparison in the tool.
Open HQSpectrum to compare your spectrum or change frequency.